Understanding OpenTelemetry: A Comprehensive Beginner's Guide
This guide will walk you through setting up a basic distributed tracing system using OpenTelemetry and Jaeger. You'll learn how to instrument a Python Flask application and visualise traces in Jaeger's UI.
Source Code: All code for this guide is available on GitHub at https://github.com/Ali-Shaikh/otel-jaeger-demo
What is OpenTelemetry?
OpenTelemetry (OTel) is an open-source observability framework that provides a standardised way to collect and export telemetry data from your applications. For this guide, we'll focus on distributed tracing, which helps you track requests as they flow through your services.
What is Jaeger?
Jaeger is an open-source distributed tracing system that helps you monitor and troubleshoot transactions in complex distributed systems. It allows you to:
- Visualise the flow of requests across services
- Identify performance bottlenecks
- Understand service dependencies
- Troubleshoot errors
Project Structure
otel-jaeger-demo/
├── app/
│   └── app.py
├── docker-compose.yml
├── Dockerfile
├── requirements.txt
└── otel-collector-config.yaml
Implementation Steps
1. The Flask Application with OpenTelemetry
Create a file app/app.py with the following code:
from flask import Flask, request
from opentelemetry import trace
from opentelemetry.sdk.trace import TracerProvider
from opentelemetry.sdk.trace.export import BatchSpanProcessor
from opentelemetry.exporter.otlp.proto.grpc.trace_exporter import OTLPSpanExporter
from opentelemetry.sdk.resources import SERVICE_NAME, Resource
from opentelemetry.instrumentation.flask import FlaskInstrumentor
from opentelemetry.instrumentation.requests import RequestsInstrumentor
import time
import random
import requests

# Configure the tracer
resource = Resource(attributes={
    SERVICE_NAME: "flask-demo-app"
})

provider = TracerProvider(resource=resource)
otlp_exporter = OTLPSpanExporter(endpoint="otel-collector:4317", insecure=True)
span_processor = BatchSpanProcessor(otlp_exporter)
provider.add_span_processor(span_processor)
trace.set_tracer_provider(provider)

# Get a tracer
tracer = trace.get_tracer(__name__)

# Create Flask app
app = Flask(__name__)

# Instrument Flask
FlaskInstrumentor().instrument_app(app)

# Instrument requests library
RequestsInstrumentor().instrument()

@app.route('/')
def home():
    return "Welcome to the OpenTelemetry Demo! Try /process or /chain"

@app.route('/process')
def process():
    # Create a custom span
    with tracer.start_as_current_span("process-request") as span:
        # Add attributes to the span
        span.set_attribute("request.type", "process")

        # Simulate variable processing time
        process_time = random.uniform(0.1, 0.5)
        span.set_attribute("process.time_seconds", process_time)

        # Add an event
        span.add_event("Starting processing")

        # Simulate work
        time.sleep(process_time)

        # Sometimes introduce errors for demonstration
        if random.random() < 0.1:  # 10% chance of error
            span.set_status(trace.StatusCode.ERROR, "Simulated process failure")
            return "Process failed!", 500

        span.add_event("Finished processing")
        return f"Processing completed in {process_time:.2f} seconds!"

@app.route('/chain')
def chain():
    # This simulates a chain of microservices
    with tracer.start_as_current_span("chain-request") as span:
        span.set_attribute("request.type", "chain")

        # Simulate first step
        time.sleep(0.1)

        # Call our own API as if it were another service
        try:
            response = requests.get(f"http://flask-app:5000/process")
            return f"Chain complete! Process response: {response.text}"
        except Exception as e:
            span.set_status(trace.StatusCode.ERROR, str(e))
            return f"Chain failed: {str(e)}", 500

if __name__ == '__main__':
    app.run(host='0.0.0.0', port=5000)
Key components in this application:
- OpenTelemetry SDK Configuration: Setting up the tracer provider and span processor
- OTLP Exporter: Sends trace data to the OpenTelemetry Collector
- Auto-instrumentation: Automatic instrumentation for Flask and requests libraries
- Custom Spans: Manual spans with custom attributes and events
- Simulated Errors: Occasionally triggered to demonstrate error tracing
2. OpenTelemetry Collector Configuration
Create a file otel-collector-config.yaml:
receivers:
  otlp:
    protocols:
      grpc:
        endpoint: 0.0.0.0:4317
      http:
        endpoint: 0.0.0.0:4318

processors:
  batch:
    timeout: 1s
  memory_limiter:
    check_interval: 1s
    limit_mib: 1000

exporters:
  debug:
    verbosity: detailed
  otlp:
    endpoint: jaeger:4317
    tls:
      insecure: true

service:
  pipelines:
    traces:
      receivers: [otlp]
      processors: [memory_limiter, batch]
      exporters: [debug, otlp]
This configuration:
- Receives traces via OTLP (both gRPC and HTTP)
- Processes traces using batching and memory limiting
- Exports traces to the debug console (for troubleshooting) and to Jaeger via OTLP
3. Requirements File
Create a file requirements.txt:
flask==3.1.0
requests==2.31.0
opentelemetry-api==1.20.0
opentelemetry-sdk==1.20.0
opentelemetry-exporter-otlp==1.20.0
opentelemetry-instrumentation-flask==0.41b0
opentelemetry-instrumentation-requests==0.41b0
4. Dockerfile
Create a file Dockerfile:
FROM python:3.11-slim

WORKDIR /app

COPY requirements.txt .
RUN pip install --no-cache-dir -r requirements.txt

COPY app/ .

CMD ["python", "app.py"]
5. Docker Compose Setup
Create a file docker-compose.yml:
version: '3.8'

services:
  # Our Flask application
  flask-app:
    build:
      context: .
      dockerfile: Dockerfile
    ports:
      - "5001:5000"
    networks:
      - otel-network
    depends_on:
      - otel-collector

  # OpenTelemetry Collector
  otel-collector:
    image: otel/opentelemetry-collector-contrib:0.90.0
    command: ["--config=/etc/otel-collector-config.yaml"]
    volumes:
      - ./otel-collector-config.yaml:/etc/otel-collector-config.yaml
    ports:
      - "4327:4317"   # OTLP gRPC
      - "4328:4318"   # OTLP HTTP
    networks:
      - otel-network
    depends_on:
      - jaeger

  # Jaeger for distributed tracing visualization
  jaeger:
    image: jaegertracing/all-in-one:1.48.0
    environment:
      - COLLECTOR_OTLP_ENABLED=true
    ports:
      - "16687:16686"  # Web UI
      - "14251:14250"  # Model
    networks:
      - otel-network

networks:
  otel-network:
    driver: bridge
This setup includes:
- Our Flask application
- OpenTelemetry Collector with the configuration mounted
- Jaeger All-in-One for trace collection and visualisation
- A shared network for communication between services
Running the Demo
Prerequisites for Windows Users
If you're running Docker Desktop on Windows, you need to ensure your drive is properly shared with Docker:
- Share Your Drive with Docker Desktop:
- Open Docker Desktop
- Click on the gear icon (Settings)
- Go to "Resources" > "File Sharing"
- Add the drive where your project is located (e.g., C:\ or D:)
- Click "Apply & Restart"
- Alternative Approach for Volume Mounts:
- If you encounter path-related errors, try using absolute paths in your volume mounts
- Path Format in Docker on Windows:
- Use forward slashes in your paths (even on Windows)
- Example:
D:/Projects/otel-jaeger-demo
Example: Instead of relative paths in docker-compose.yml:
volumes:
  - ./otel-collector-config.yaml:/etc/otel-collector-config.yaml
Use absolute paths:
volumes:
  - D:/path/to/otel-jaeger-demo/otel-collector-config.yaml:/etc/otel-collector-config.yaml
Starting the Services
- Open a terminal in your project folder
- Run:
docker-compose up --build - Wait for all services to start
Generating Telemetry Data
Visit these URLs in your browser to generate different types of telemetry:
http://localhost:5001/- Homepagehttp://localhost:5001/process- Simple processing endpointhttp://localhost:5001/chain- Simulated microservice chain
Pro tip: Refresh each endpoint multiple times to generate more data!
Viewing Traces in Jaeger
- Open
http://localhost:16687in your browser - From the "Service" dropdown, select "flask-demo-app"
- Click "Find Traces" to see your recent traces
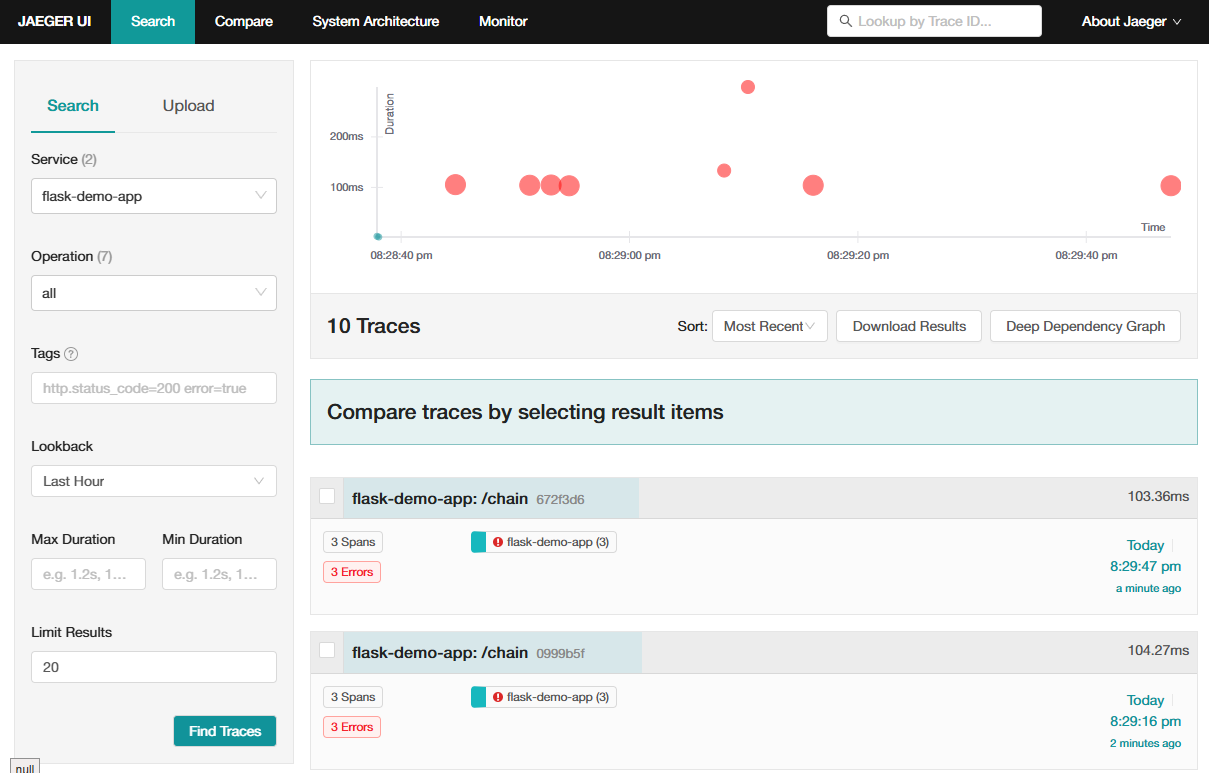
When viewing traces in Jaeger, look for:
- Trace Timeline: The waterfall view showing span durations
- Span Details: Click on spans to see attributes, events, and logs
- Service Dependencies: How requests flow across services
- Error Traces: Highlighted in red, with error details
Example: The "/chain" Endpoint
When you call the "/chain" endpoint, you should see a trace with:
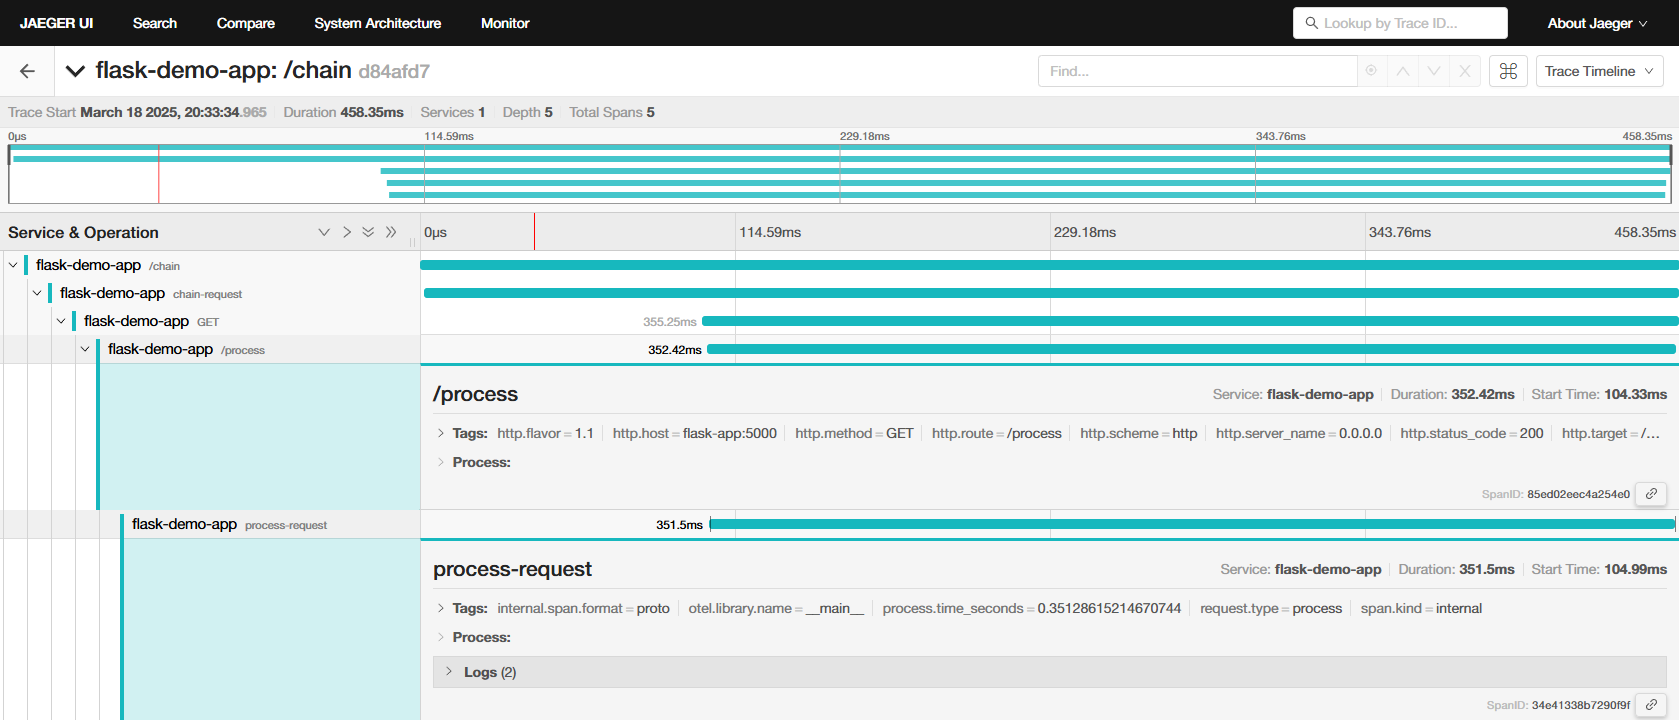
- A parent span for the "/chain" request
- A child span for the "chain-request" custom span
- A child span for the HTTP request to "/process"
- A child span for the "/process" request
- A child span for the "process-request" custom span
This demonstrates how OpenTelemetry propagates context across service boundaries.
Troubleshooting
No Traces in Jaeger?
- Check container logs:
docker-compose logs otel-collector - Verify the OTLP endpoint is configured correctly in your app
- Ensure you've generated traffic by visiting your endpoints
Connection Issues?
- Check network connectivity between containers
- Verify ports are correctly exposed and not in conflict
Windows-specific Issues
- Ensure your drive is properly shared with Docker Desktop
- Check Docker Desktop logs for permission errors
- Try using absolute paths in volume mounts
- Ensure Windows security software isn't blocking Docker's file access
Next Steps
Now that you have a working OpenTelemetry and Jaeger setup, you might want to:
- Add More Services: Create additional services to trace distributed transactions
- Implement Sampling Strategies: For high-volume applications
- Add Custom Attributes: Track business-specific data in your traces
- Set Up Persistent Storage: For long-term trace storage
- Explore Advanced Jaeger Features: Like service dependency graphs
Conclusion
You've successfully set up distributed tracing with OpenTelemetry and Jaeger! This foundation gives you visibility into your application's behaviour, helps identify performance bottlenecks, and accelerates debugging.
Remember, observability is not just about tools—it's about gaining insights that lead to better application performance and reliability. With OpenTelemetry's standardised approach, you can future-proof your observability strategy regardless of which vendors or backends you choose.
Start small, focus on high-value metrics and traces, and gradually expand your observability coverage as you grow more comfortable with these tools.
Happy monitoring!
Member discussion